Third i vs Whatagraph: Reporting vs Recommendations
Looking for a Whatagraph alternative? Whatagraph is an AI-powered marketing reporting platform. It pulls data from 55+ sources, blends it, and turns it into white-labeled dashboards your clients can understand. Third i is an AI action platform for performance marketing agencies. It starts from the…

Whatagraph is a strong product. If your biggest pain is stitching data from multiple platforms into visually clean client reports, it does that very well. Agencies praise its drag-and-drop report builder, white labeling, and AI summaries that help turn raw numbers into narrative their clients can actually read.
But if you are a performance marketing agency, you know that reporting is only half the job. Showing clients what happened is necessary. Telling your team what to do next is where the actual value lies.
This post breaks down where Whatagraph shines, where it struggles for day-to-day performance marketers, and how Third i changes the workflow.
What Whatagraph Does Well
Whatagraph is positioned as an "AI-powered marketing intelligence platform" that replaces messy spreadsheets and complex BI tools with a simpler workflow. You connect your channels, organize data into spaces, then build dashboards and reports using templates or their AI assistant.
Some things it does genuinely well:
- Wide integrations. Over 55 native connectors plus custom sources via API, Google Sheets, or BigQuery. If your client runs ads or organic across Meta, Google, TikTok, LinkedIn, and more, you can get it all into one place.
- White-labeled reporting. Themes, custom domains, and client portals let you present dashboards that look like your agency built them from scratch. Their "auto-branding" feature can generate a theme from your brandbook or even a screenshot.
- Templates and linked templates. You can build a template for one client, then reuse it across dozens of similar accounts. Update once, push the change to all.
- AI summaries and chat. Their IQ chat bot can summarize performance, answer questions in natural language, and drop that text directly into a report.
If your main bottleneck is "we spend too much time exporting CSVs and building slide decks," Whatagraph absolutely reduces that pain.
But as you scale your agency, three issues show up repeatedly.
The Three Pain Points Agencies Keep Mentioning
1. Reporting, Not Diagnosis
Whatagraph's AI and templates make it easier to see data. They do not actually decide what to do with that data.
Most of their marketing emphasizes reporting: turn complex data into clear visuals, create white-labeled dashboards at scale, automate sends, export to BigQuery or Looker Studio. That is all valuable. But at the end of every report is the same question: "So what now?"
You, the strategist, still have to answer that.
Improvado's guide to marketing reporting tools summarizes this limitation for tools in this category: they are great for consolidating and visualizing data, but you still need someone reading those charts every week and forming hypotheses.
Whatagraph's own content leans heavily on templates and visuals. They highlight drag-and-drop widgets, 100+ templates, and white-labeling far more than any automated diagnosis of what is actually broken in your campaigns.
Third i starts from a different end of the problem. Instead of focusing on the report, it focuses on the action. The Action Feed is not another dashboard. It is a ranked list of fixes, complete with plain language explanations and expected business impact. The goal is not to make your data look pretty. It is to reduce the time between "performance issue" and "issue fixed."
2. Credit-Based Pricing That Punishes Scale
Whatagraph's pricing uses "source credits" as the core unit. Each connected data account uses one credit. Plans are structured around how many credits you need, not how many users or reports.
Their public pricing as of early 2026 looks roughly like this:
- Free plan: limited reporting with a small number of source credits
- Start: around 199-229 dollars per month billed annually, includes a limited pool of credits
- Boost: around 399-463 dollars per month billed annually, with more credits and advanced features
- Max: custom pricing for larger teams with high credit needs
A 2026 pricing analysis by Reporting Ninja breaks it down more bluntly: paid plans start at 249 euros per month for Start, increase to 624 euros for Boost, and then move to custom pricing. The main cost driver is how many sources you connect, not the number of reports or users.
For a growing agency, this has two implications:
- Every new client you onboard increases your cost, even if their reporting needs are simple.
- Moving a single client from three channels to five channels consumes more credits, pushing you toward the next tier.
One Software Advice reviewer warned that Whatagraph can become expensive quickly for agencies: "For marketing agencies especially in the US I would highly say to stay away. These people are extremely harsh and do not have their customers' best interest in mind."
Third i uses flat pricing. It is $199 per month regardless of how many ad accounts or clients you connect. No credits. No per-source fees. No surprises when you add a new platform to a client's mix.
3. Limited Depth of Insight for Sophisticated Analysis
Whatagraph is optimized for clarity and speed, not for deep analysis.
Their own review of AgencyAnalytics, written from an agency perspective, calls out a limitation that applies to most template-driven tools: when you need sophisticated analysis, you often "hit a wall." Users mention the inability to create advanced custom metrics, limited data blending, and dashboards that feel "no better than what you could build for free in Looker Studio" once you need something beyond standard KPIs.
On G2 and Capterra, common complaints include:
- Trouble getting genuinely custom views for more complex clients
- Frustration when scheduled reports arrive with missing or empty data because an integration glitched
- Feeling locked into pre-defined widgets that are hard to adapt to unusual reporting needs
Whatagraph counters this by emphasizing improvements in data blending and custom formulas, but the pattern remains: it is first and foremost a reporting tool, not an analysis or optimization engine.
Third i does not try to be your client reporting layer at all. It assumes you either already have something for that or can export insights into whatever client-facing format you prefer. Its job is to do the deep analysis for you: find campaign-level and creative-level issues across platforms, correlate them with GA4 conversion data, and surface the specific fixes that will move the needle.
Feature Comparison
[table content removed during migration — recreate manually]
The Core Difference: Reporting vs Recommendations
If you strip away the AI labels, the difference is simple.
Whatagraph answers: "How do I present my results to clients clearly and consistently?"
Third i answers: "What should I work on today to improve performance across my clients?"
Many agencies need both.
It is entirely reasonable to use Whatagraph to send beautiful weekly or monthly reports to clients while using Third i internally to decide which campaigns to scale, which creatives to refresh, and where budget is leaking.
But if you have to pick one primary system to invest in, it comes down to where your bottleneck is.
If your team spends more time elbow-deep in spreadsheets, manually building the same charts twenty times a week, Whatagraph will save you hours per week on every client.
If your bottleneck is not reporting but figuring out what the numbers actually mean for your next move, Third i is where you should start.
Real Results from Third i Users
- Outthinking (mobile gaming, 300M+ downloads) achieved a 40 percent lower cost per install using Third i's AI-led audience and creative insights. CEO Pavan said: "Thirdi's AI and expert driven capabilities have proven to be effective, as we acquired new users at 40 percent lower costs."
- Kraftwork Solar saw a 400 percent increase in lead volume in 45 days and a 48 percent lower lead acquisition cost. Their Co-founder said: "Third i's expertise has been pivotal in transitioning Kraftwork Solar from traditional marketing to a high-performing lead generation engine."
- A FinTech platform achieved a 6x improvement in lead quality through targeted audience segmentation and channel optimization.
- Sadhana Tablet achieved 3.2x ROAS within 3 months across US and India markets.
These results are documented in our case studies
When Whatagraph Might Still Be the Right Choice
Choose Whatagraph if your primary challenge is reporting. If you need to consolidate dozens of data sources into a single, client-friendly view. If white-label dashboards, custom domains, and AI-written summaries are critical to how your agency communicates value. If your clients care most about having a polished place to log in and see what is happening.
Choose Third i if your primary challenge is deciding what to do next. If you already have a reporting setup but lack a system that continuously scans performance across Meta, TikTok, Google Ads, LinkedIn Ads, and GA4 and tells you which actions will have the highest impact. If you are tired of paying more every time you add a new platform or client account. And if you want predictable pricing that does not depend on credits or source counts.
.
Frequently Asked Questions
What is the best alternative to Whatagraph in 2026?
It depends on your use case. If you want another reporting-focused platform, tools like AgencyAnalytics, Databox, and Reporting Ninja are strong alternatives. If you want a platform that goes beyond reporting into automated diagnosis and action prioritization across multiple ad platforms, Third i is worth evaluating.
How much does Whatagraph cost compared to Third i?
According to Whatagraph's public pricing, paid plans start around 199-229 dollars per month for the Start tier, rise to roughly 399-463 dollars for Boost, and move to custom pricing for Max, with the main cost driver being how many data sources you connect. External analyses put euro pricing at 249 euros for Start and 624 euros for Boost. Third i is a flat $199 per month with no credit system and no per-source fees.
Does Whatagraph replace my need for Third i?
No. Whatagraph is primarily a reporting and visualization tool. It helps you see data and present it to clients. Third i is focused on diagnosis and actions. It analyzes your campaign performance across platforms and tells you which changes will have the biggest impact. Many agencies will get the most value from using both: one for reporting, one for optimization.
Can Third i replace Whatagraph for client reporting?
Third i is not designed to send client-facing dashboards. You can export insights and use them in whatever reporting stack you prefer, including Whatagraph, Looker Studio, or slides. Its strength is in analysis and recommendations, not presentation.
Is Whatagraph good for agencies?
Whatagraph is explicitly built for agencies and brands. Agencies that value white-labeled dashboards, client portals, and AI-assisted summary writing often find it a good fit. The main concern is cost as you scale clients and data sources, since pricing is credit-based rather than flat.
Does Whatagraph have AI like Third i?
Yes, Whatagraph has an AI chatbot and AI summaries that help you build reports and explain performance. The key difference is focus. Their AI is centered around report creation and explanation. Third i's AI is centered around performance diagnosis and action recommendations.
Getting Started
If your clients already get regular reports but you still scramble every Monday to decide which campaigns to fix first, adding another reporting tool will not change that.Connecting your ad accounts to Third i will.Meta, TikTok, Google Ads, LinkedIn Ads, and GA4 plug in directly. Within about 60 seconds, you get a prioritized Action Feed across all clients and all platforms.
No credits. No source limits. No rules to configure. Just a clear list of what to do next.
The longer you wait, the more budget leaks go undetected.
Also read:
Third i vs Supermetrics | Third i vs GoMarble | Third i vs Triple Whale | Third i vs Revealbot
Third i is not affiliated with or endorsed by Whatagraph. All product names, logos, and brands are property of their respective owners. Pricing and feature information is based on publicly available data as of March 2026. Visit whatagraph.com for their latest offerings.
Read more
View all articles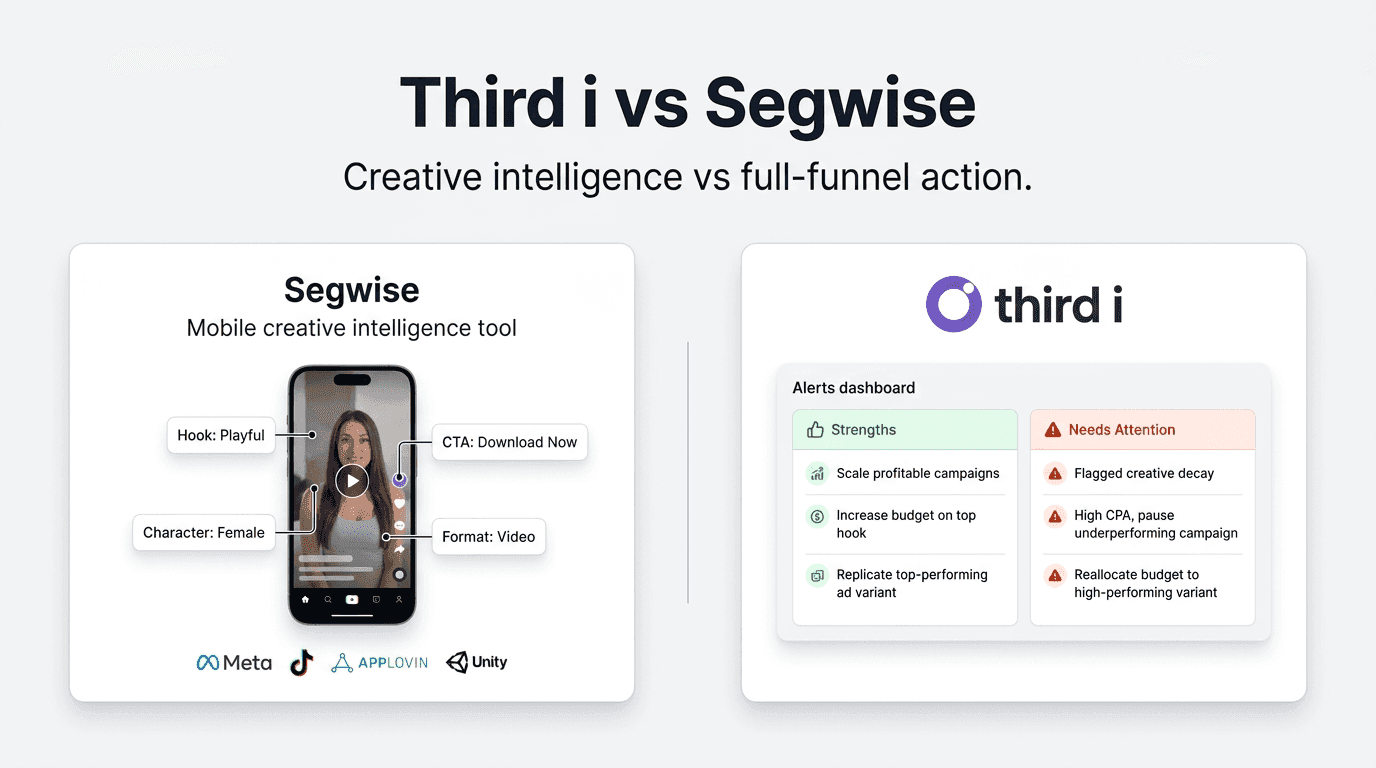
Third i vs Segwise: Creative Intelligence vs Full-Funnel Action Intelligence
Evaluating Segwise or looking for a Segwise alternative? Segwise is an AI-powered creative intelligence platform built specifically for mobile app and gaming advertisers. It automatically tags every element inside your ad creatives - video, audio, text, playable mechanics - and ties those elements…
Vishal Singh
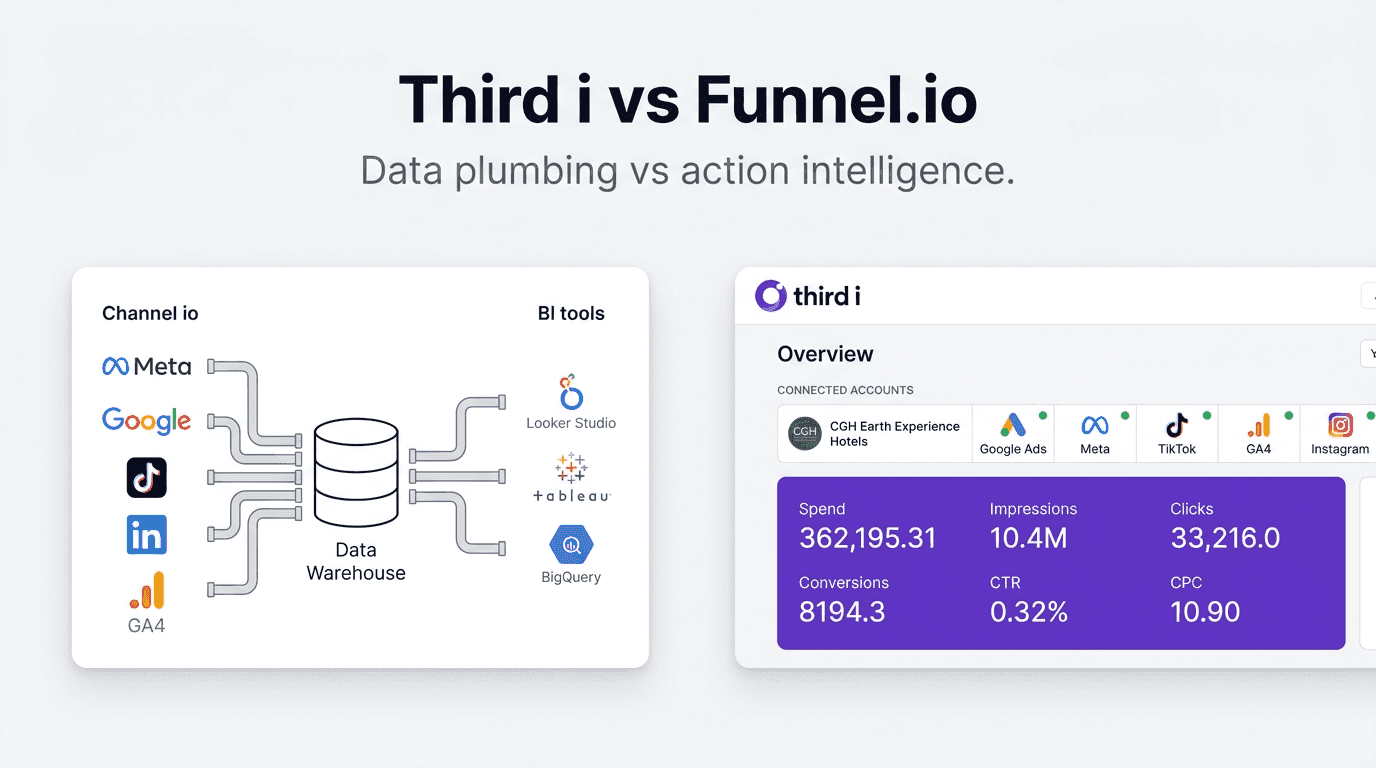
Third i vs Funnel.io: Data Pipeline vs Action Intelligence
Evaluating Funnel.io or looking for an alternative? Funnel.io is a marketing data hub that connects 600+ sources, normalizes your data, and pipes it into your BI tool, data warehouse, or reporting layer. It collects and cleans your data. Third i is an AI action platform that tells you what to do wi…
Vishal Singh
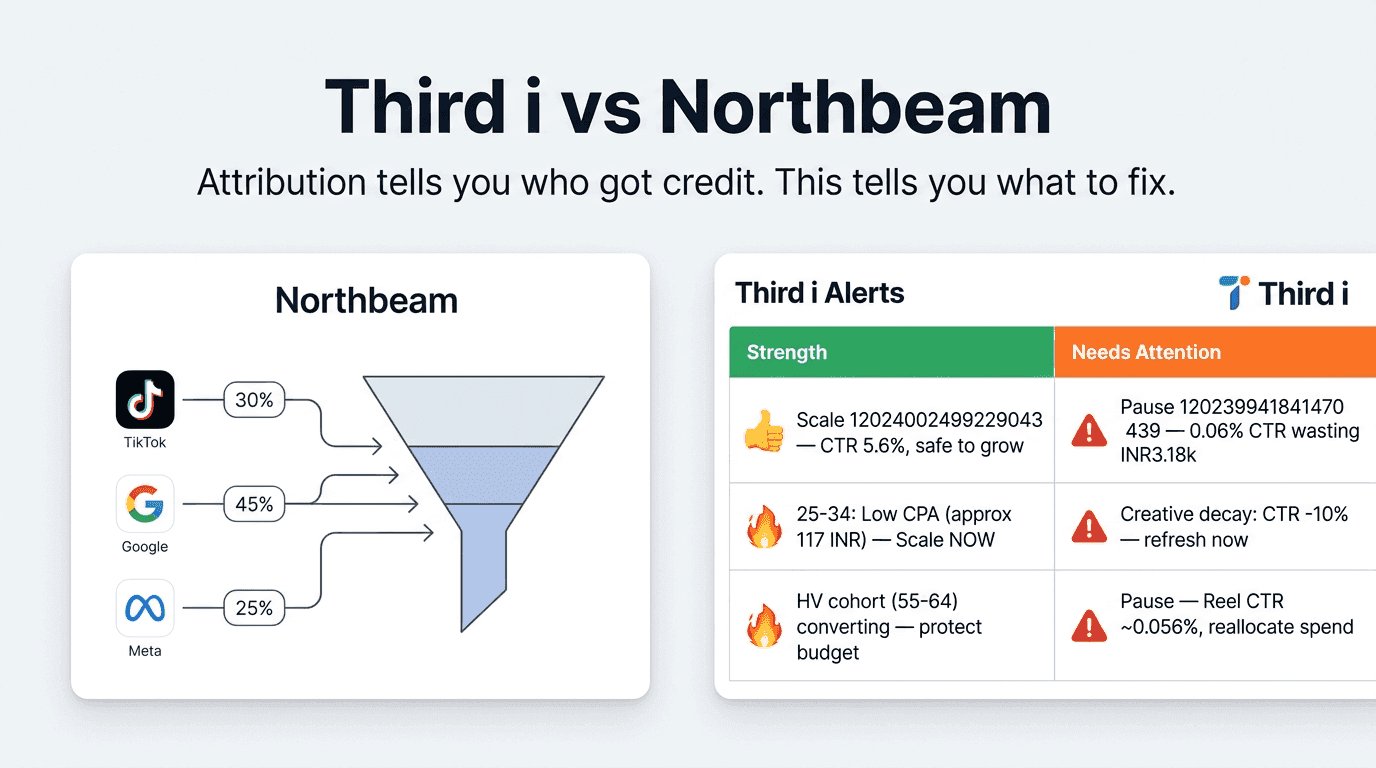
Third i vs Northbeam: Attribution Measurement vs Action Intelligence
Evaluating Northbeam or looking for a Northbeam alternative? Northbeam is a multi-touch attribution and media mix modeling platform built for mid-size to enterprise DTC and ecommerce brands spending over $50K per month on ads. It helps you understand how credit should be distributed across your mar…
Vishal Singh